
A PDF is useful when someone needs a fixed reporting snapshot they can email, print, present, or archive. It is not a substitute for the live Data Studio report: interactive filters stop working, the data does not refresh, and the file can remain in circulation after access to the original report changes.
Google now uses the Data Studio name again. Older interfaces, URLs, and guides may refer to the same reporting product as Looker Studio.
To download a Data Studio report as a PDF:
- Open the report in view or edit mode.
- Apply the date range, filters, and data-control selection you want the PDF to contain.
- Select Share, then Download report.
- Choose all pages or selected pages and configure the PDF options.
- Select Download, then inspect the finished file before distributing it.
The rest of this guide explains each step, including page order, password protection, scheduled delivery, and what to do when downloading is disabled.
Set the report view before downloading
A PDF captures the report state at the time it is generated. Before opening the download dialog, confirm:
- the reporting period;
- filter and quick-filter selections;
- the selected account, property, campaign, location, or business unit;
- any data-control selection;
- table pagination and other relevant chart interactions; and
- when the underlying data last refreshed.
This matters most when one report contains several clients, properties, or business units. A technically successful export can still be the wrong report if a previous viewer's filter or data-control selection remains active.
The sample below uses Google's public GA4 Merchandise Store data. It is set to a complete 30-day period and shows the date and active filter controls within the report.
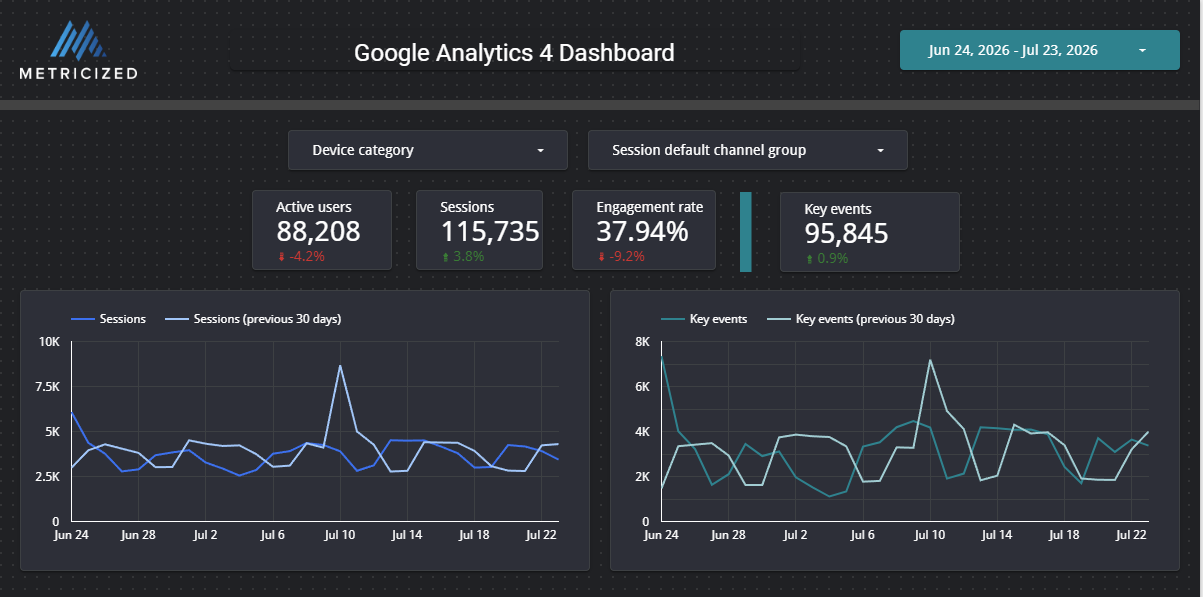
Set the intended date range and filters before generating the PDF.
Download the report
In the upper-right corner of the report, open the menu next to Share and select Download report.
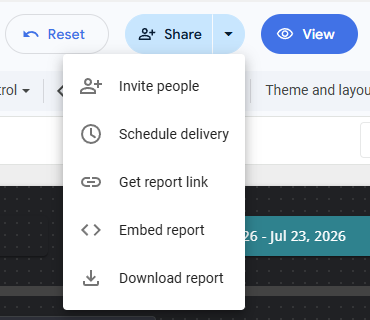
Open the Share menu and select Download report.
When editing a report, you can also use File > Download as > PDF. Both paths open the same download dialog.
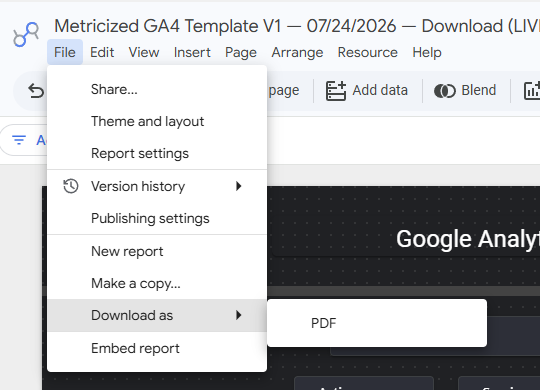
Editors can reach the same dialog through File > Download as > PDF.
Choose pages and PDF options
For a multi-page report, select All Pages or Select Pages. When you select individual pages, drag them into the order you want in the PDF. This changes only the exported file; it does not rearrange the live report.
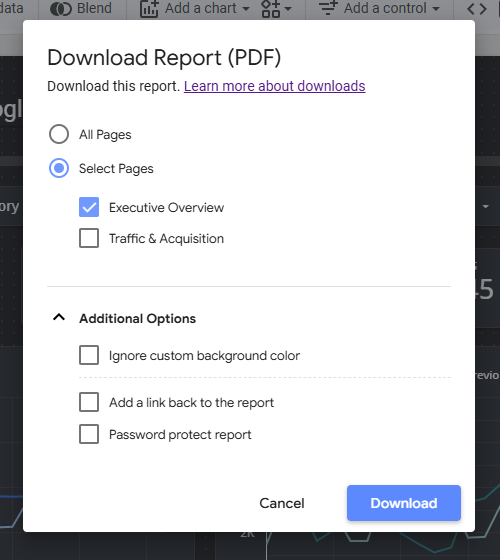
Choose the report pages and configure the additional PDF options.
The available options include:
Ignore custom background color
Use this when the report's custom background should not appear in the PDF. Google describes the resulting PDF background as transparent. Check the finished file in the PDF viewer and presentation software your recipient will use, particularly when the report contains light text or charts designed for a dark background.
Add a link back to the report
This adds a way back to the live report from supported PDF viewers. The link does not grant access. Share the live report with the recipient separately and give them at least the Viewer role if you expect them to open it.
Password protect report
Use password protection when it is appropriate for the report's sensitivity and your organization's delivery policy. Send the password through a separate approved channel rather than placing it in the same email as the PDF.
Password protection reduces casual access to the file, but it does not control what an authorized recipient does after opening it. Avoid including data that the recipient does not need.
Data Studio Pro PDF options
Data Studio Pro can expand supported tables and pivot tables to show additional rows and can add page numbers to multi-page PDFs. Expanded visualizations have layout limitations: components below an expanded table may move, while nearby or overlapping components can produce an awkward result. Treat these as export features that still require visual review.
For the latest option details, see Google's PDF download documentation.
Validate the PDF before distributing it
Opening the file is part of the export process, not an optional final glance. Check that:
- every intended page is present and in the correct order;
- the reporting period and filter context are visible or documented;
- charts render without system errors;
- tables are not clipped or misleadingly truncated;
- totals and key figures match the live report;
- labels, legends, and small text remain readable;
- any embedded report or website links work as intended;
- the filename identifies the report and reporting period; and
- the file contains only information appropriate for its recipients.
In a current test using the Metricized GA4 sample report, Data Studio rendered the complete report as one long PDF page. The 30-day period, report colors, charts, tables, and existing Metricized links carried into the file. That test also demonstrates why validation is necessary: report length and page design determine the PDF layout, not a conventional paper size.
If the file will be printed or presented, test that use separately. A PDF that looks acceptable on a large monitor may still be difficult to read on paper or on a phone.
What to do when Download report is unavailable
The report owner or an administrator can disable downloading, printing, and copying. Treat that restriction as an access-control decision.
Do not install a capture extension or attempt to reconstruct the report as a way around the restriction. Instead:
- ask the owner to provide an authorized PDF;
- request the report permission appropriate to your work; or
- ask whether a view-only link is the approved delivery method.
Google documents these controls in Data Studio sharing settings.
Troubleshoot incomplete or failed PDF exports
Complex and multi-page reports can take time to render. If the download appears to fail, wait briefly and check the browser's downloads folder before starting another export.
If the PDF is incomplete or contains chart errors:
- Confirm that every selected page is present.
- Try exporting only the essential pages.
- Split a large report into smaller reports when repeated exports time out.
- Identify any chart displaying a system error and test that chart in the live report.
- Check whether protected BigQuery data or VPC Service Controls prevent the offline PDF process from reaching the underlying data.
Reducing the number of pages can help with rendering failures, but it should not be used to conceal a poorly designed report. If stakeholders regularly need different levels of detail, create a clear reporting hierarchy rather than placing every chart on one page.
Schedule recurring PDF delivery
For a report that must be sent on a recurring basis, open Share and select Schedule delivery. Choose the included pages, start date, frequency, time, and recipients.
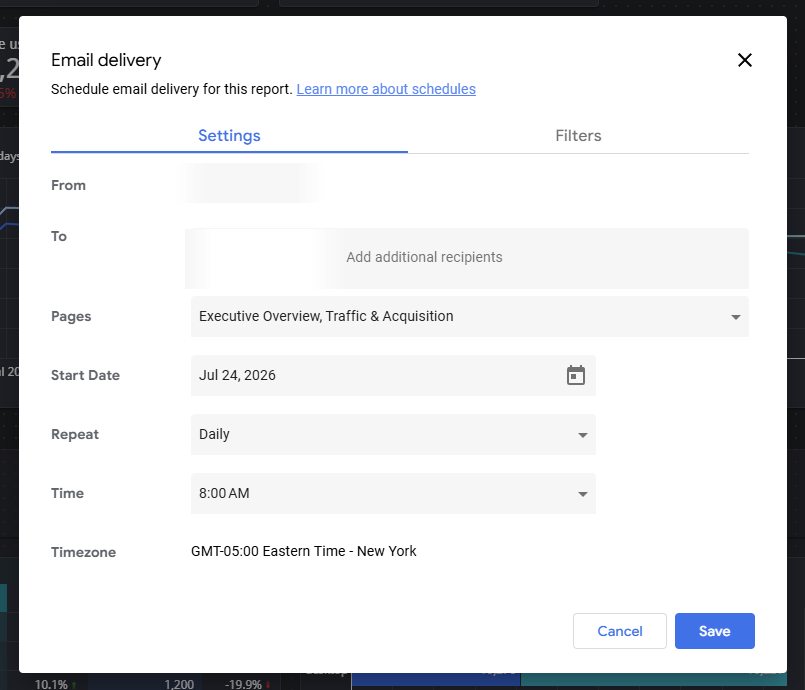
Configure the pages, timing, and delivery frequency. Recipient details are concealed in this example.
By default, a scheduled PDF uses the report's default filter controls and date range. Open the Filters tab to assign different values to that schedule. You can change controls already present in the report, but you cannot create or delete report controls from the schedule.
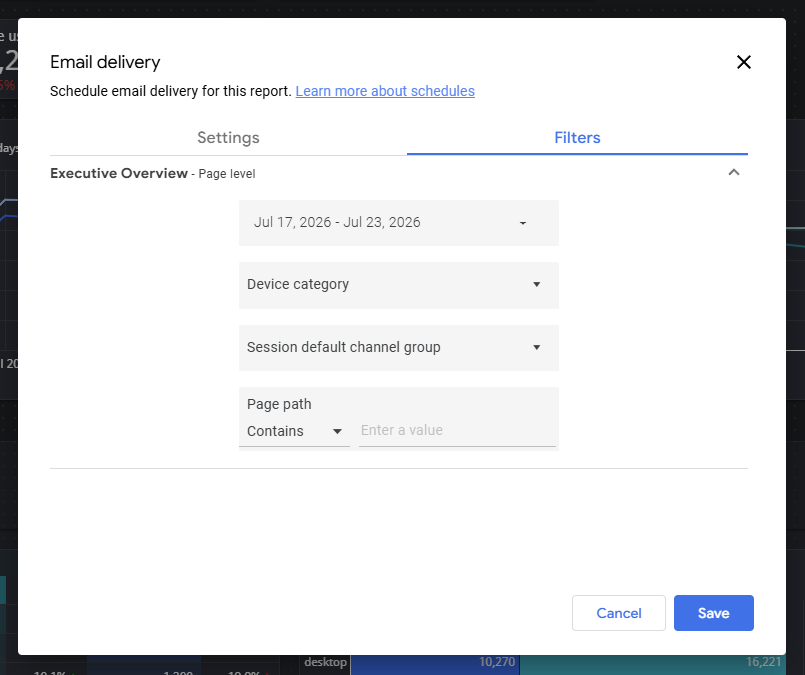
Use the Filters tab when the scheduled PDF needs its own date range or filter values.
Review schedules after changing the live report. Updating a report's default filter values does not automatically update the values stored in an existing schedule. If a filter is removed from the report, however, it is removed from the schedules as well.
For standard email delivery:
- the schedule creator remains one of the recipients;
- a schedule can include up to 50 recipient addresses;
- the email preview includes no more than five pages, while the attached PDF includes all selected pages;
- the schedule uses the operating system's timezone; and
- reports outside Data Studio Pro are limited to one schedule per report and a maximum frequency of once per day.
Data Studio Pro adds capabilities such as multiple schedules and Send now. Review Google's scheduled-delivery documentation before designing a workflow around account or recipient limits.
Scheduling removes a manual step, but it does not remove the need for report ownership. Someone should periodically confirm that the data refreshed, the filters remain correct, the PDF rendered properly, and the recipient list is still appropriate.
PDF or live report link?
Choose the delivery method based on what the recipient needs to do.
| Use a PDF when the recipient needs | Use a live link when the recipient needs |
|---|---|
| A fixed reporting-period snapshot | Current data that continues to refresh |
| An offline, printable, or archivable file | Interactive filters and drill-downs |
| A controlled presentation of selected pages | The ability to investigate results |
| A file attached to a recurring email | Access governed through report permissions |
A live link can preserve a configured view, including filters, date range, data-control selection, table pagination, and some chart interactions. Share the report with the recipient before sending the link; the URL itself does not create permission.
See Google's guidance on linking to the current report view for the supported report state.
Start with a reusable GA4 report
If you need a practical starting point, review the Metricized GA4 Data Studio template. It provides a reusable report structure that you can connect to your own GA4 property and adapt to the decisions your stakeholders actually make.