

Google increased the GA4 Data API token quotas in May 2023, but it did not remove quota errors from Data Studio. Standard GA4 properties now receive eight times as many daily and hourly tokens as they did when enforcement reached Data Studio in November 2022. The concurrent-request limit, however, remains 10 requests per property.
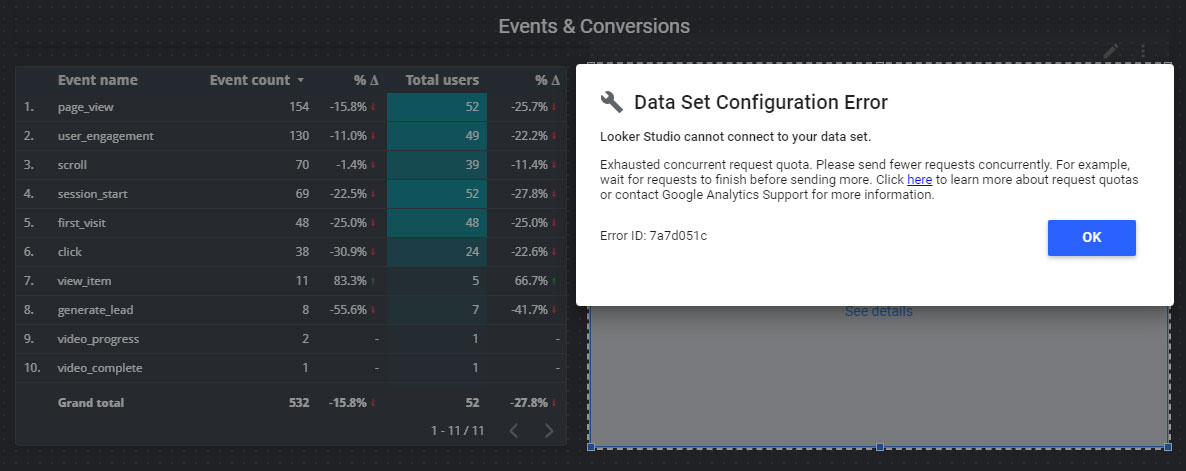
That distinction explains why a report can show thousands of tokens remaining and still fail with an "Exhausted concurrent request quota" message. Token consumption and simultaneous requests are separate limits.
This guide explains what changed, how to identify the limit you reached, and when to optimize a report, extract the data, or move reporting to BigQuery.
The short answer
If a GA4-connected Data Studio report displays a quota error:
- Read the complete error message before changing the report.
- Open the Google Analytics Token Usage dialog in edit mode.
- Determine whether the problem is concurrency, hourly or daily tokens, thresholded requests, or repeated server errors.
- Reduce unnecessary charts and expensive queries if the report itself is the cause.
- Improve cache reuse with a shared data-source and credential strategy.
- Use Extract Data for a bounded, refreshable snapshot.
- Use modeled BigQuery tables when the dashboard is business-critical, combines sources, or needs durable history.
Waiting for a quota to reset may restore the report temporarily. It does not solve a recurring design or data-architecture problem.
Why the errors became common in 2022
On November 7, 2022, Data Studio reports connected to GA4 became subject to Google Analytics Data API quotas. Google's November release notes specifically announced enforcement of concurrent-request quotas. Reports that had worked before the change could suddenly fail during an ordinary page load.
Google added the Google Analytics Token Usage dialog in December 2022. In May 2023, it raised the token allowances and rebalanced the way requests are charged.
| Standard GA4 core quota | Late 2022 | Current limit | Change |
|---|---|---|---|
| Tokens per property per day | 25,000 | 200,000 | 8x |
| Tokens per property per hour | 5,000 | 40,000 | 8x |
| Tokens per project per property per hour | 1,750 | 14,000 | 8x |
| Concurrent requests per property | 10 | 10 | No increase |
The higher token limits made many simple reports more practical. They did not make every report eight times more resilient. Google also began charging complex requests more precisely. Queries covering more than six months can consume 1,000 or more tokens, while most ordinary requests consume 10 or fewer.
What a concurrent-request error means
A concurrent-request error means too many requests against the property are being executed at the same time. It does not mean that the daily token balance is empty.
A page with numerous GA4 charts can initiate several requests at once. Other reports, viewers, scheduled activity, and applications using the same property can contribute to the shared load. Standard properties allow 10 concurrent Core requests; Analytics 360 properties allow 50.
The current interface may still say "Looker Studio" in the error dialog even though the product is now named Data Studio.
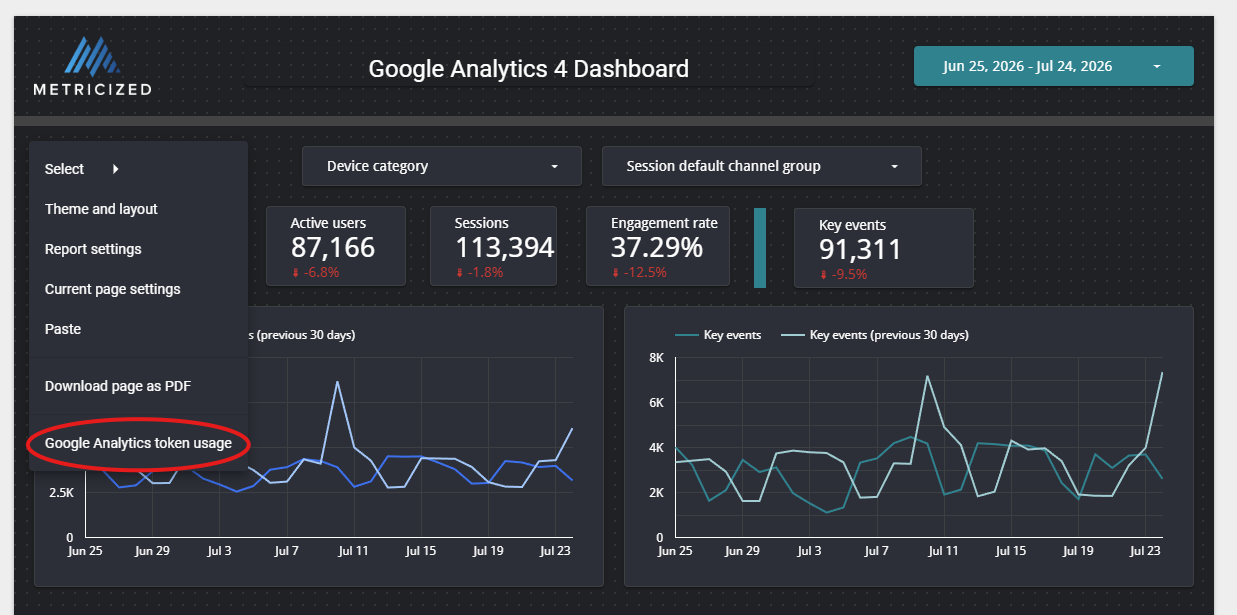
Check report and component token usage
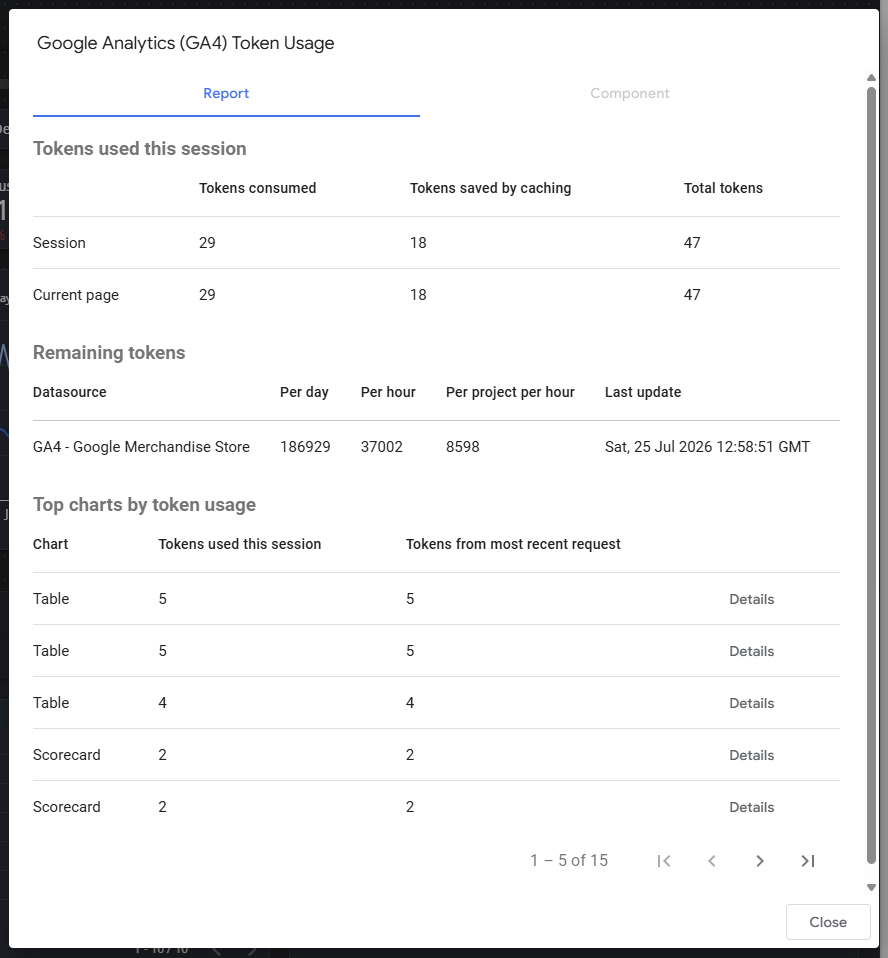
In report edit mode, right-click an empty area of the canvas and select Google Analytics token usage. The Report tab shows:
- tokens consumed during the session;
- tokens saved through caching;
- remaining daily and hourly balances; and
- charts using the most tokens.
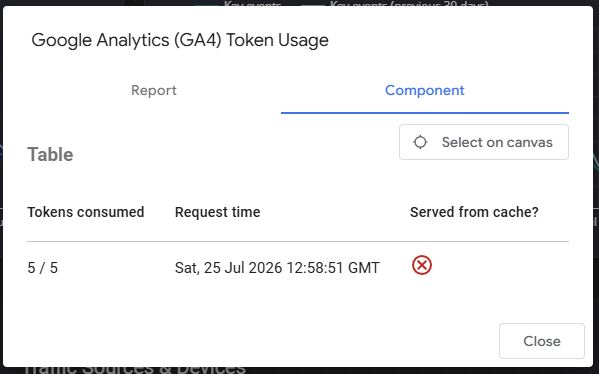
Right-click a specific chart and open the same dialog to inspect that component. The Component tab shows the tokens consumed by its request and whether the result was served from cache.
These values are diagnostic evidence, not a complete concurrency monitor. A healthy remaining-token balance does not rule out ten requests running simultaneously.
Match the fix to the error
Google documents several distinct quota-related messages:
- exhausted concurrent requests;
- too many requests in the last hour or day;
- too many project-and-property requests in the last hour;
- too many potentially thresholded requests;
- too many server errors; and
- denied access to the Analytics property.
Do not treat all of these as one problem. An access error needs a credential or permission correction. A thresholding error involves privacy-sensitive dimensions. A concurrency error calls for fewer simultaneous requests or a different data-delivery design.
1. Reduce simultaneous and unnecessary requests
Start with the report page that fails:
- remove charts that repeat the same decision or metric;
- divide unrelated questions across focused pages;
- avoid embedding a complex live GA4 report on a high-traffic public page;
- remove controls that do not support a defined decision;
- consolidate duplicate GA4 data sources where practical; and
- test the page with the number of simultaneous viewers it actually needs to support.
Reducing the number of displayed table rows can lower token cost when it reduces the requested rows, but it does not necessarily reduce the number of simultaneous API requests. Removing an entire unnecessary chart usually has a more direct effect on concurrency.
2. Reduce expensive queries
Google identifies the following contributors to token consumption:
- more returned rows;
- additional dimensions and metrics;
- complex filters;
- longer date ranges;
- high-cardinality dimensions such as page paths or custom dimensions; and
- higher event volume in the property.
Use a sensible default reporting window, such as the last 30 days, instead of loading years of history on every view. Keep long-range analysis available when it serves a real question, but do not make it the default query for every chart and viewer.
This is also a reporting-quality decision. A smaller dashboard is not automatically better; it is better when each remaining component has a defined audience, question, and action.
3. Improve cache reuse
Data Studio temporarily stores query results and may serve a repeated query from memory until the data-freshness threshold is exceeded. Google recommends owner's credentials and reusable data sources where appropriate because consistent requests are more likely to reuse cached results.
For the Google Analytics connector, available freshness settings are one, four, or twelve hours, with twelve hours as the default. A shorter setting requests fresh data more frequently and can increase quota usage. Choose the freshness required by the business decision rather than selecting the shortest interval by habit.
Owner's credentials also create an access responsibility: viewers can see data through the owner's authorization. Confirm the report audience and data permissions before changing credentials merely to improve caching.
4. Use Extract Data for a bounded snapshot
Extract Data can be a practical option when the report needs a defined subset of fields and scheduled refreshes rather than a live request for every view. The extracted source can load faster and avoid repeated live GA4 queries.
Current limits include 100 MB and 750,000 rows per extracted data source. Extracts are therefore best for compact operational dashboards, prototypes, and reports with predictable fields and history. They are less suitable for large, evolving data models or analysis that regularly requires new dimensions.
5. Use BigQuery when the reporting requirement is durable
BigQuery is usually the stronger architecture when:
- the dashboard is business-critical or has many viewers;
- several reports compete for the same GA4 property quotas;
- the business needs durable event-level history;
- GA4 must be combined with advertising, CRM, financial, or operational data;
- definitions need governed SQL models; or
- report performance and reproducibility matter more than a quick connector setup.
GA4 can export raw event data to BigQuery for Standard and Analytics 360 properties. Standard properties have a one-million-event daily batch-export limit, while streaming export has different availability and cost considerations. BigQuery also introduces storage, query, modeling, monitoring, access-control, and maintenance responsibilities.
BigQuery output should not be expected to reproduce every number in the GA4 interface automatically. The export contains raw events, while the Analytics interface can apply attribution, modeling, identity, and processing rules. Define the intended metric grain and reconcile representative totals before presenting a warehouse-backed dashboard as authoritative.
Which solution should you choose?
| Situation | Best starting point |
|---|---|
| One crowded page occasionally fails | Remove redundant charts and inspect component usage |
| Tokens remain but the page reports concurrent requests | Reduce simultaneous chart requests and test multi-viewer load |
| Repeated queries consume tokens unnecessarily | Consolidate sources and improve cache reuse |
| Small report with predictable fields and scheduled refreshes | Extract Data |
| Multi-source, high-volume, long-history, or critical reporting | BigQuery with modeled reporting tables |
| Enterprise property already using Analytics 360 | Use the higher limits, but still optimize report and data design |
Upgrading a connector or account can raise capacity, but it should not be used to hide a poorly scoped report.
Prevent quota errors before sharing a report
Before distributing a GA4 report:
- Confirm the property, date range, time zone, filters, and metric definitions.
- Inspect report-level and component-level token usage.
- Test whether important requests are being served from cache.
- Remove decorative or redundant components.
- Test controls and navigation in View mode.
- Test with realistic simultaneous use.
- Document the source, refresh expectations, and last validation date.
- Decide what happens if the native connector is unavailable during a scheduled review or client presentation.
For a compact starting point, see How to Create a Data Studio Report From Scratch. For point-in-time delivery, see How to Download a Data Studio Report as a PDF.
Frequently asked questions
Did Google fix the GA4 Data Studio quota problem?
Google substantially improved token capacity in 2023, but it did not remove the quotas. The Standard-property concurrent-request limit remains 10, and complex requests can still consume significant tokens.
Why do I receive a concurrent error when tokens remain?
Concurrency measures requests running at the same time. Daily and hourly token balances measure accumulated consumption. A report can exceed one limit while remaining comfortably within another.
How long do I have to wait for quotas to reset?
Google says daily quotas refresh at midnight Pacific Standard Time. Hourly quotas refresh within an hour, but not necessarily at the top of the hour. Concurrent capacity becomes available when active requests finish.
Will BigQuery eliminate GA4 Data API quota errors?
A report querying BigQuery no longer depends on the GA4 Data API for those queries. It will instead be subject to BigQuery costs, quotas, permissions, and the quality of the reporting model. Moving the connector without designing and validating the data model is not a complete solution.
Sources and editorial note
Primary references:
- Data Studio troubleshooting guide
- Google Analytics Data API quotas
- May 2023 token-quota changes
- Data Studio 2022 release notes
- Manage data freshness
- Extract data for faster performance
- GA4 BigQuery Export
Product limits and recommendations link to first-party Google documentation accessed July 25, 2026.