
Free Power BI marketing dashboard template
Start with a Power BI marketing report you can inspect.
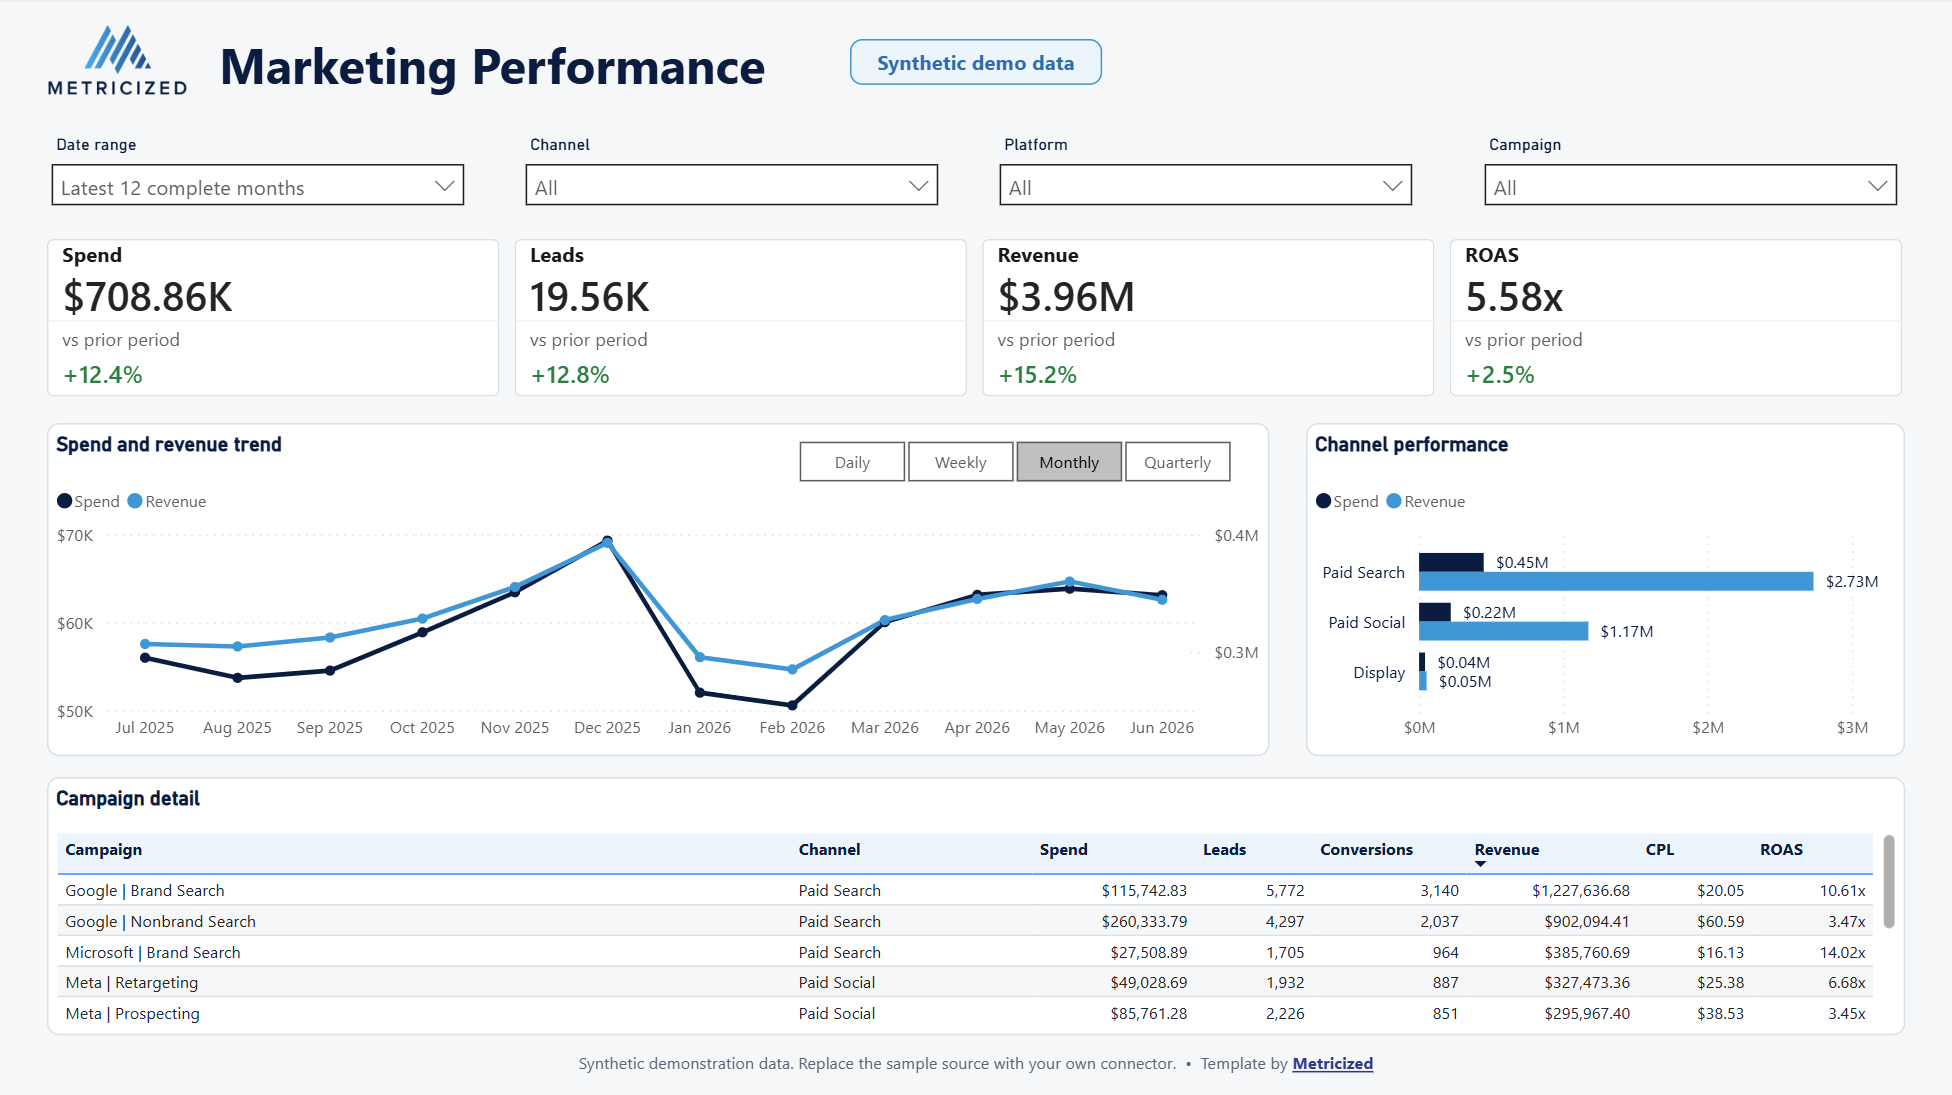
Download a working PBIX with a documented marketing-performance model, calendar-aware prior-period comparisons, flexible trend grain, and layouts designed for desktop and mobile.
Inside the report
A usable starting model, not an empty canvas.
The report is deliberately compact. It brings the main performance questions, comparison logic, and campaign context together without pretending to be a universal attribution model.
Performance overview
Spend, leads, revenue, and ROAS with visible prior-period percentage comparisons.
Flexible time analysis
Complete-month presets with daily, weekly, monthly, and quarterly trend grain.
Campaign context
Channel comparison, campaign detail, and filters for channel, platform, and campaign.
Responsive layout
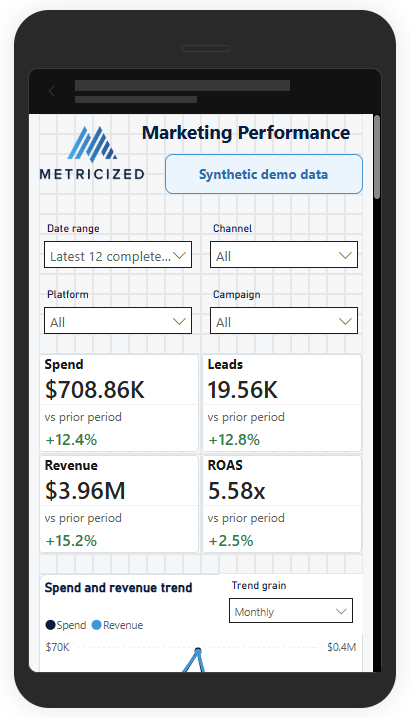
A maintained mobile view keeps the decision summary, filters, and core charts usable on a smaller screen.
Desktop and mobile
The mobile view is part of the template.
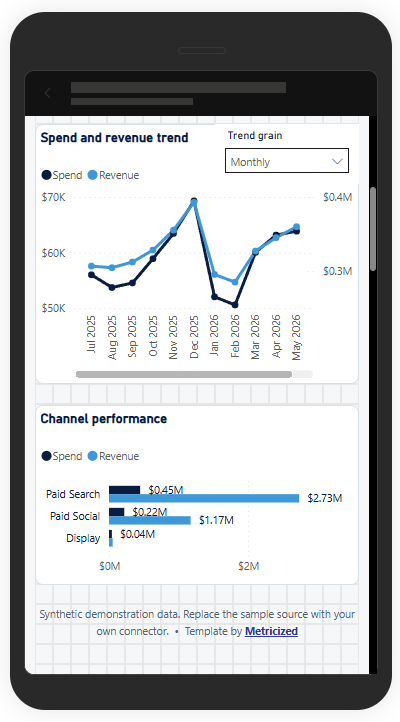
The mobile layout is intentionally focused. It retains the report context, filters, KPI comparisons, trend, and channel view while leaving the denser campaign table on the desktop canvas.
- Filters remain visible and usable.
- Prior-period labels stay attached to each KPI.
- The trend-grain control remains available.
- No separate or simplified dataset is required.
From sample to your source
Replace the connector, then validate the model.
The downloaded PBIX opens with synthetic data already loaded. Your production result depends on mapping the expected fields and reconciling the model against your own definitions.
-
01
Download and open
Open the PBIX in a current version of Power BI Desktop.
-
02
Inspect the sample
Review the model, measures, report interactions, and layouts.
-
03
Replace the source
Connect your platform, warehouse, or file and map the required fields.
-
04
Reconcile before publishing
Validate dates, currencies, definitions, filters, calculations, and totals.
Know where the template stops
A working PBIX is not a production implementation.
Before relying on the adapted report:
- Map your source fields to the expected schema.
- Confirm attribution and KPI definitions.
- Reconcile period logic, currencies, and totals.
- Plan refresh, workspace, access, and governance separately.
Before you download
A few useful boundaries.
Does the PBIX contain real business data?
No. It contains a generated two-year marketing-performance snapshot. The visible results do not represent Metricized or a client.
Will it connect automatically to my platforms?
No. Replace the sample source with your connector and map the fields expected by the model.
What do I need to open it?
Use a current version of Power BI Desktop for Windows. Power BI Service licensing and publication permissions are separate.
Can Metricized customize the model and report?
Yes. Customization can cover sources, calculations, report structure, branding, validation, refresh, and production handoff.
Use the working starting point
Inspect the model. Replace the source. Validate the result.
Use the free template when its structure fits. If your reporting model, definitions, governance, or audience requires something different, a custom build would require a separately defined scope.